Separating Hydrological and Tectonic Signals in Geodetic Observations Reno, Nevada, October 11-13, 2010 |
|
Last edited 06 December 2010.
INTRODUCTION
Objective
The workshop has the objective to make progress towards improved applicability of geodetic observations for hydrological and global change studies. The focus of this workshop will be on the separation of hydrological and tectonic signals in geodetic observations of Earth's time-variable gravity field, surface displacements, and rotation. In regions like the Southwestern U.S., the Mediterranean, Northern India, East Africa, and large parts of East Asia, tectonic processes and changes in land water storage produce overlapping signals in geodetic observations. At the same time, these regions experience water scarcity and would benefit from improved water management informed by improved data on water storage changes. In order to fully utilize the potential of geodetic observations to provide estimates of land water storage changes in these regions, the tectonic and hydrological signals need to be separated. In other regions, geodetic signals of present-day changes in water storage are superimposed by contributions from large past changes in glaciers, ice sheets and large lakes hampering the use of geodetic observations as constraints for current climate change impacts.
Scope
The workshop will consider processes in the Earth system that impact geodetic observations on sub-daily to secular time scales and on sub-kilometer to global spatial scales. As illustrated in the figure below, on the solid earth side, these processes include volcanic and geothermal activities, post-seismic deformation, the response to surface loading, plate boundaries, and global geodynamics. In the fluid envelope, all mass redistribution in atmosphere, oceans, land water storage, and the cryosphere need to be considered. In scope, the workshop will focus on a few selected regions, where large tectonic signals have the potential to bias the hydrological information. Focal regions will include the Southwestern U.S., where the EarthScope program provides insight into the relevant tectonic processes, East Africa, where an extension of the AfricaArray may lead to improved observations, and Northwest India, where GRACE has indicated large changes in land water storage with the potential for a major water crisis.
Goals
The workshop will review the current state knowledge with respect to the geodetic fingerprints of the tectonic and hydrological processes, and the main challenges in modeling and separating the various contributions will be identified. The workshop will aim to make progress towards an agenda to address these challenges through focused research projects.
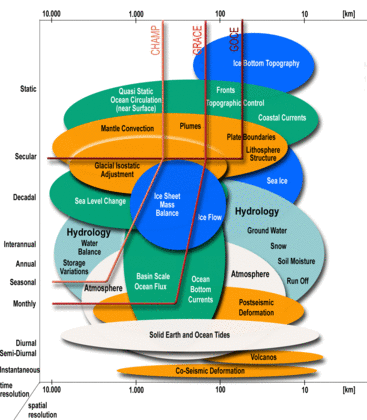 |
Geodetic observations carry signals of a wide range of processes in the solid Earth and its fluid envelope. The geodetic fingerprints of these processes have temporal time scales from instantaneous to secular, and spatial time scales from local point movements to global. The figure illustrates the spatial and temporal scales for gravity, and a similar figure applies to surface displacements as well. From Ilk et al. (2005). |
Output: The planned outputs of the Workshop include:
- Presentations and posters available through the web page;
- Recommendations;
- Workshop report on the Workshop Web page;
- Summary articles in appropriate journals (including Episodes and EOS);
- A special issue in an appropriate journal.
PROGRAM OVERVIEW
Sunday, October 10, 2010
| 17:00 - 19:00: | Arrival & Registration |
Monday, October 11, 2010
| 0800 - 0845: | Registration & Coffee |
| 0845 - 0905: | Opening and Welcome |
| 0905 - 1045: | P1: Hydrology, Tectonics, and Geodesy: Status and Challenges (Co-chairs: Jay Famiglietti, David Lavallee) |
| 1045 - 1115: | Coffee Break |
| 1115 - 1300: | P2: Transient tectonic and hydrological signals (Co-chairs: Matthew Rodell, Jessica Murray) |
| 1300 - 1400: | Lunch |
| 1400 - 1545: | P3: Case Studies: The Western U.S. (Co-Chairs: Norman Miller, Elias Lewi) |
| 1545 - 1615: | Coffee Break |
| 1615 - 1700: | P3: Case Studies: East Africa (Co-Chairs: Norman Miller, Elias Lewi) |
| 1700 - 1730: | P4: The Broader Context (Chair: nn) |
| 1730 - 1830: | Poster session (Co-Chairs: Norman Miller, Hans-Peter Plag) |
| 1900 - 2100: | No-Host Dinner |
Tuesday, October 12, 2010
| 0830 - 0900: | Coffee |
| 0900 - 1045: | Breakout Sessions: B1: Forward modeling of tectonic and hydrological signals (Co-Chairs: William Hammond, Jean-Paul Boy) B2: Separation of signals on micro to basin scales (Co-Chairs: Shimon Wodowinski, Charles Meertens, Michel van Camp, Ty Ferre) |
| 1045 - 1115: | Coffee Break |
| 1115 - 1300: | Continuation of Breakout Sessions |
| 1300 - 1400: | Lunch |
| 1400 - 1545: | Breakout Sessions: B3: Separating plate tectonics, postglacial rebound and contemporary global change signals (Co-Chairs: Bert Vermeersen, Holger Steffen) B4: Improving the observation system and consistency of fingerprints in surface displacements, gravity and rotation (Co-Chairs: Xioaping Wu, Peter Clarke, Gerald Bawden, John LaBrecque) |
| 1545 - 1615: | Coffee Break |
| 1615 - 1800: | Continuation of Breakout Sessions |
| 1900 - 2100: | Workshop Dinner |
Wednesday, October 13, 2010
| 0830 - 0900: | Coffee |
| 0900 - 1045: | P5: Reports from the Breakout Sessions (Co-Chairs: nn, nn) |
| 1045 - 1115: | Coffee Break |
| 1115 - 1300: | P6: Discussion of the science challenges (Co-Chairs: nn, nn) |
| 1300 - 1400: | Lunch |
| 1400 - 1545: | P7: The view forward (Co-Chairs: Norman Miller, Hans-Peter Plag) |
Abstracts
Session P1:
Between a rocky planet and a watery place: the problem of observing the solid Earth and hydrosphere together
Peter Clarke
University of Newcastle, U.K.
Comprehensive tracking of the water cycle remains a tricky problem, in part because water resources are spatially widely distributed and take many different forms (including oceans, snow, ice, lakes and rivers, soil moisture, ground water, and atmospheric water vapour), and in part because some of these forms are invisible or unconstrained by traditional measurements on the Earth's surface. Geodetic techniques offer the possibility of tracking all water mass movements, by observing one or more of (i) the change in Earth's gravitational field, (ii) the change in Earth's shape caused by the alteration in the surface mass load, and (iii) the variation in the Earth's rotation axis and rate caused by the change in its inertia tensor. However, these observations are also sensitive to changes with different causes, such as tectonics, glacio-isostatic adjustment, and other mass movements; furthermore, each technique has advantages and disadvantages resulting from its spatial/temporal sampling density and its susceptibility to random and systematic errors. This overview presentation will explore these issues, to set the scene for more detailed discussions during the workshop.
Characterizing tectonic and fluid production deformation signals in GPS and InSAR time-series
Bawden, Gerald W. and Sneed, Michelle
US Geological Survey, Sacramento; gbawden@usgs.gov
Large ground-surface deformations associated with anthropogenic fluid withdrawal and injection represent unique challenges for resolving the subtle surface deformation associated with slip at depth on faults and the migration of magmatic fluids. At the same time, these large signals offer new opportunities to better understand managed groundwater, hydrocarbon, and geothermal systems such that they can be characterized and modeled, and then their effects can be filtered out of tectonic/volcanic time-series measurements. Fluid production can have several influences on a geodetic time series: 1) pumping of unconfined aquifers may produce little, if any, measurable surface deformation outside of gravity changes but may have longer-term loading/unloading effects if the net fluid production is unbalanced; 2) elastic deformation, where fluid recharge/extraction is in balance, will typically result in seasonal uplift/subsidence with accompanying horizontal surface deformation orthogonal to the deformation gradient, but with little to no net permanent deformation; and 3) inelastic deformation, where the net fluid flux is out of balance, will produce permanent horizontal and vertical deformation signals in GPS and InSAR time series data. The timing of the geodetic measurements with respect to the fluid production is also a key factor in initially identifying time-series trends. This is especially true where there is quasi-steady state fluid pumping/injection that can mimic or mask tectonic/magmatic signal in GPS time series, however, the fluid-production effects can be isolated and characterized with InSAR imagery.
Coseismic and postseismic gravity changes by the 2010 Chile Earthquake: Separating hydrological and tectonic signals in GRACE data
Heki, Kosuke; Matsuo, Koji
Dept. Natural History Sci., Hokkaido University; heki@mail.sci.hokudai.ac.jp
After the 2004 great Sumatra-Andaman Earthquake, GRACE first detected coseismic (Han et al., Science, 2006) and postseismic (Ogawa and Heki, GRL, 2007) gravity and geoid height changes. The February 27, 2010, Chile Earthquake, which ruptured the Constitucion-Conception seismic gap, was the largest earthquake (Mw8.8) after that. Here we report its co- and postseismic gravity changes. Three months of GRACE data after the earthquake are available at the moment, and the gravity time series show significant negative jump reaching five microgals centered at the back arc side of the focal region, a signature similar to the 2004 Sumatra earthquake. The observed changes are consistent with those predicted for the realistic spherical layered earth (Sun et al., GJI, 2008) assuming fault parameters determined by coseismic displacements of GPS stations (e.g. Delouis et al., GRL, 2010). Although it is premature to discuss postseismic gravity changes, gravity appears to decrease around the focal plane after the earthquake, which is somewhat different from postseismic gravity increase observed after the 2004 Sumatra Earthquake. Gravity variations in southern South America, except those related to earthquakes, are governed by seasonal changes in soil moisture with amplitudes modulated by the ENSO index (Morishita and Heki, EPSL, 2008). Seasonal signals in central Chile are expected to show slight increase in the postseismic period (from March to summer), and it is of crucial importance to remove land hydrological signals in order to tell whether postseismic gravity in Chile is increasing or decreasing.
Global Present-Day Surface Water Mass Transport and GIA from Joint Inversions of Multi-Satellite and Interdisciplinary Data
Wu, Xiaoping
Jet Propulsion Laboratory, CALTECH; Xiaoping.Wu@jpl.nasa.gov
GRACE time-variable gravity measurements in the past several years have created the richest information for a single technique with nearly global coverage and high precision about present-day surface water mass transport, glacial isostatic adjustment (GIA), and other geophysical processes. Still, other data and models of these processes have been used to achieve real global coverage, improve precision and sort out contributions of individual processes. However, many geophysical models of these processes are not accurate to modern geodetic precisions. They usually contain no statistical assessment of uncertainties and may have large errors. The largest uncertainty factor in determining present-day surface water transport trend from GRACE gravity measurements is perhaps the contamination from errors of GIA models used to remove GIA from data. Still, the models, especially those constrained by data and with some indications of uncertainties will turn out to be very useful if used properly. Preferably, more data sets with complementary information should be used to resolve the various signatures and to improve the models. In this talk, I will review various data types used in global inversions, their information contents, technical problems and challenges. Their roles and contributions to our understanding and determination of the major geophysical processes will then be discussed, often in the context of global inverse schemes. An example of a recent simultaneous inversion of present-day surface water mass trend and GIA will be given briefly followed by a discussion of future opportunities and challenges in methodology, parameterization and data fusion.
Session P2:
Large-scale Terrestrial Water Storage Change From GRACE
Chen, Jianli
Center for Space Research, University of Texas at Austin, Austin, TX, chen@csr.utexas.edu
Satellite gravity observations from the Gravity Recovery and Climate Experiment (GRACE) provide a unique means for monitoring large-scale terrestrial water storage (TWS) change on a global basis. The over 8 years GRACE data have revealed a coherent picture of large-scale transient hydrologic signals, and captured some major climate and environmental change features, including severe droughts and floods, excessive groundwater depletions, and ice melting from polar ice sheets and mountain glaciers. This presentation will show some example studies of GRACE satellite gravity data in monitoring and quantifying the global water cycle and some major climate events, including the exceptional 2009 Amazon flood and the extended drought conditions in the La Plata basin in recent years.
Transient deformation signals related to hydrology: Examples, mechanisms, and significance
Roeloffs, Evelyn
US Geological Survey, Vancouver, WA, evelynr@usgs.gov
Transient signals related to hydrology have been recorded by creepmeters, borehole strainmeters, and two-color EDM measurements for a decade or more prior to the widespread implementation of high-resolution space geodesy techniques. Understanding these observations is greatly facilitated by comparing the deformation measurements with records of groundwater levels, surface-water discharge, and precipitation when those are available from nearby sites. In many cases, hydrologic phenomena are unrelated to the tectonic or magmatic processes being studied and are important only because they introduce noise into the measurements. For example, creepmeters can record displacements caused by incremental downslope movement of near-surface materials, usually in response to heavy rainfall on soils that are already very wet ? conditions similar to those well-known to cause landslides. Borehole strainmeters respond to a wide variety of hydrologic sources: the weight of precipitation on the ground surface; discharge changes in nearby rivers; groundwater pressure variations caused by pumping; and the natural fluid pressure variations due to seasonal rainfall and evapotranspiration. It should be noted that fault movement and seismic waves change subsurface fluid pressures and groundwater discharge. In particular, seismic waves can initiate persistent water-level changes as far as hundreds of km from the epicenter. Nearby borehole strainmeters also record signals in some of these cases, raising the issue of whether the signal is caused fundamentally by deformation, or by fluid pressure change. Some data show that fluid-pressure changes from distant earthquake occur at depths of several km, and suggest they may be related to remotely triggered seismicity. Groundwater level variations generally complete a cycle with an approximately annual period, but time histories of pressure change are too complicated to approximate with a small number of harmonic components. Exact repeatability from year to year is the exception rather than the rule. The onset of annual recharge is frequently very abrupt, and so are pressure changes caused by different initiation times for irrigation, as spring weather varies from year to year. Regardless of the cause, abrupt changes are broadband signals that are very difficult to filter from deformation data. Although complete removal of hydrologic "noise" from deformation records is challenging, identification of such signals is facilitated by accumulating a long-term record not only of deformation, but also of hydrologic variations near the site.
Coseismic gravitational changes from great earthquakes
Jacob, Thomas; Gross, Richard; Wahr, John
thomas.jacob@colorado.edu
This study focuses on coseismic gravitational changes caused by the static deformation of the Earth generated from earthquakes. Using a normal mode summation scheme and source models for past great earthquakes, the initial, elastic, coseismic geoid height changes and surface gravity changes are evaluated. Emphasis is first made on the 1960 Chile earthquake and the 1964 Alaska earthquake. The coseismic geodetic signals from these earthquakes are compared to hydrological geodetic signals from the GLDAS/NOAH and CLM4.0 land surface models. Great earthquakes having occurred during the GRACE era are then investigated: the 2004 Sumatra earthquake and the recent 2010 Chile earthquake.
Combining InSAR and GPS data to distinguish coseismic and postseismic slip in the 2003 San Simeon and 2004 Parkfield earthquakes
Johanson, Ingrid A.; Bürgmann, Roland
Berkeley Seismological Laboratory; Ingrid@seismo.berkeley.edu
InSAR provides deformation measurements with tens-of-meters spatial resolution, providing detailed information on the locations and spatial distribution of deformation sources. However, interferograms provide a snapshot of ground motions within the time spanned by the two satellite acquisitions, with a minimum span of 1 month (for most satellites). Continuous GPS and other ground-based instruments can provide data with time resolutions of at least 1 second, but at a limited number of locations. By using information from GPS data on the temporal evolution of postseismic slip, we construct a model inversion scheme that separates coseismic from postseismic slip in the InSAR data. This allows us to leverage the high resolution of InSAR data to determine separate spatial distributions for each process. For the 2004 M6.0 Parkfield earthquake, continuous GPS data from 12 sites show a consistent postseismic decay pattern that is well fit by an exponential function. The decay time constant determined from the GPS data is used to construct Green?s functions relating the total amplitude of the postseismic slip to deformation within the given time periods of eight interferograms. Separate slip distributions for coseismic and postseismic slip are determined simultaneously during the model inversion and reveal that postseismic slip tended to occur in areas that did not slip coseismically and especially occurred up-dip and to the north of the coseismic rupture. The thrust-mechanism 2003 M6.5 San Simeon earthquake was more spatially and temporally complex. In this case, the InSAR data is not well fit by a single postseismic decay function and less GPS data is available to constrain the time dependence of the postseismic slip. Nonetheless a simultaneous inversion suggests shallow afterslip occurred on multiple structures including the main rupture plane and two backthrusts, and allows the possibility of coseismic slip on a backthrust structure.
Session P3:
Secular vertical crustal deformation field in California and Nevada regions from GPS data analysis: Hydrological and anthropogenic signals
Dong, Danan; Fang, P.; Bock, Y.; Webb, F.; Kedar, S.; Lundgren P.
Jet Propulsion Laboratory, danan.dong@jpl.nasa.gov
We have reanalyzed 13.25 years of global and regional continuous GPS (CGPS) data in the period 1997.0-2010.25 with the goal of improving the precision and accuracy of the vertical component to detect tectonic signals in the California and Nevada region. The regional data set includes daily coordinate time series from 657 stations with at least 3.0 years of data. The time series are derived from a combination of independent GPS analyses at our two institutions but with a common source of station metadata. In this paper we identify locations with non-tectonic vertical signals, which are due to primarily hydrologic and anthropogenic effects such as groundwater volume undulation, compaction of the aquifer skeleton, and magma intrusion and retreat. Modeling the vertical time series indicates that the precision of our derived vertical velocities is on the order of 1 mm/yr or less. Agreement with published InSAR analyses and aquifer volume variation data indicates also that our vertical estimates provide a valid physical measurement with an accuracy of about 1 mm/yr, which is sufficiently clean of errors and artifacts to provide effective and reliable means for groundwater monitoring and management. We show that it is important to identify and consider hydrological and anthropogenic effects when searching for and interpreting underlying tectonic signals with primarily vertical expression.
Transient Hydrological Effects from Surface Loading and Pumping in the Western U.S. Observed with the Plate Boundary Observatory
Meertens, C. 1; Boursa, A. 1; Herring, T. 2; Jackson, M. 1; van Dam, T. 3; Wahr, J. 4
1 UNAVCO, 2 MIT, 3 University of Luxembourg, 4 University of Colorado, Boulder; meertens@unavco.org
The Plate Boundary Observatory (PBO) GPS network of over 1,200 continuously operating GPS stations in the W. U.S. is providing accurate and spatially coherent vertical signals that can be interpreted in terms of hydrological loading and poroelastic effects from both natural and anthropogenic changes in water storage. Data for this analysis are the precise coordinate time series produced on a daily basis by PBO Analysis Centers at New Mexico Institute of Mining and Technology and at Central Washington University and combined by the Analysis Center Coordinator at the Massachusetts Institute of Technology. These products, as well as derived velocity solutions, are made freely available from the UNAVCO Data Center in Boulder. Post-processed air pressure loading corrections are produced by the University of Luxembourg Analysis of interannual trends and annual variations in the time series are determined using the analysis software of Langbein, 2008. Spatial variations in the amplitude and phase of the annual vertical component of motion allow for identification of anthropogenic effects due to water pumping, irrigation, and reservoir lake variations, and of outliers due to instrumental or other local site effects. Vertical annual signals of 8-10 mm peak-to-peak amplitude are evident at stations in the mountains of northern and central California and the Pacific Northwest. The peak annual uplift is in October and is correlated to hydrological loading effects. Mountainous areas appear to be responding elastically to the load of the water contained in surface soil, fractures, and snow. This vertical elastic hydrologic loading contribution can be modeled using the Global Land Data Assimilation System (GLDAS) and the NOAA ?Leaky Bucket? hydrologic models. In contrast to mountain stations that are installed principally in bedrock, stations in the valleys of California are installed in sediments. Observations from these stations show greater spatial variability ranging from almost no detectable annual signal to very large, 20-30 mm, vertical amplitudes that reach a maximum in March. Vertical signals in the valleys are the result of poroelastic effects induced by groundwater variations caused by pumping for irrigation or other purposes and are highest when groundwater is at maximum recharge level. Interannual trends in the vertical time series typically show rates of 1-3 mm/yr across the western U.S. In areas of groundwater pumping the rates can be considerably greater approaching several cm/yr showing subsidence as pumping exceeds annual recharge over a multi-year time period. In the mountainous areas where hydrologic loading is evident in the annual signals, interannual trends show uplift of 1-3 mm/yr possibly due to regional drought and decreased overall water volumes that result in less load and vertical uplift. Overall, these results illustrate the potential of using GPS data to constrain hydrological models. In return, accurate hydrologic loading models will be needed to better measure and detect vertical tectonic motions at the mm-level.
Observations of the spatial and temporal distributions of gravity and water-mass change in the western United States
Pool, Don; Kennedy, Jeff; Conway, Brian
US Geological Survey, Tucson, AZ, drpool@usgs.gov
Gravity change has been monitored by the U.S. Geological Survey and Arizona Department of Water Resources at hundreds of stations across several networks in the alluvial basins of Arizona using relative and absolute gravity meters since about 1998. A few stations have records of change using crystalline rock stations as a reference for relative gravity surveys since 1993. Networks are installed to monitor both episodic local groundwater recharge and regional trends in groundwater storage, and therefore have different frequencies and durations of surveys. Local recharge monitoring networks are commonly located near ephemeral channels and have been surveyed frequently, with days to weeks between surveys, immediately following recharge events and tend to be short duration projects. Regional networks maintained by the Arizona Department of Water Resources are surveyed at least once every other year. Regional networks in the Tucson, Sierra Vista, Prescott, and Yuma areas maintained by the U.S. Geological Survey have been surveyed annually and portions are surveyed as frequently as quarterly. Most stations are located in locally elevated areas for the purpose of minimizing the effects of variations in soil moisture. Nearby pumping wells and artificial recharge facilities are also avoided. Where possible, stations are located at monitor wells where depths-to-water observations provide additional information on the vertical distribution of storage change. The monitored periods at these networks have included extended drought as well as one or more brief periods of recharge-producing precipitation. Observed gravity changes can be grouped into two categories: large but short-term increases and slower long-term declines. Large short-term gravity changes of 100 æGal or more occur over periods of days to weeks tend and to be concentrated along ephemeral streams. These rapid increases tend to dissipate over periods of weeks to months as the infiltrated water migrates laterally and spreads across a large area in the subsurface. Long-term declines in gravity occur over periods of months to years between recharge events due to groundwater withdrawals, groundwater subflow, and discharge to streamflow. Additional networks of limited extent have recently been established in mountainous terrain in the Black Hills of South Dakota and in a watershed in the eastern Sierra Nevada Mountains. Early trends at these sites indicate that some stations exhibit tens of æGal of increases in gravity following major recharge periods, while other stations exhibit little to no change. The greatest changes tend to occur near ridges; however, further monitoring and correlation of gravity change with local physiography, soils, and geology is needed to better understand the distributions of change in these areas.
GPS Geodesy Experiments in the East African Rift
D. Sarah Stamps, Eric Calais, Elifuraha Saria, Lucy M. Flesch, Daniel Koehn, Laura Bennati, Haylee Dickinson
The East African Rift (EAR), spanning more than 6,000 km N-S and 2,000 km E-W, is the Earth’s major divergent plate boundary separating the Nubian and Somalian plates. Although the process of continental rifting is of primary importance to seismic and volcanic hazards, ocean formation, and vital natural resources, the underlying physics remains debated. A first step towards understanding the dynamics of the EAR is identifying the geometry and relative plate motions. Plate motions and strain distribution along and across diverse rift settings, measurable from GPS observations, is a key data set required to elucidate the kinematics and dynamics of continental rifting.
We present four projects that utilize GPS geodesy to address key questions about continental rifting: 1) Constraints on mantle-lithosphere interactions in East Africa, 2) Structural expression of extreme rift-flank uplift, 3) Kinematic constraints on the Lwandle-Somalian plate boundary, and 4) Magma-tectonic processes in an active transitional rift from seismic, GPS, and modeling studies in Afar. GPS observations span the Afar region in the northern part of the EAR, the central EAR from the western branch in Uganda to the eastern branch in Tanzania and eastward to the continental island of Madagascar.
The role of high precision geodetic survey in ground water exploration: A case study from Borena Zone, Southern Ethiopia
Elias Lewi1, Yelebe Birhanu2 and Shimeles Fisseha1
1 Institute of Geophysics Space Science and Astronomy, Addis Ababa University, Addis Ababa, Ethiopia.
2 Department of Geosciences, University of Montana, Missoula, Montana, USA
Gravity survey has long been considered as an expensive operation and a secondary method in hydrogeological explorations because of the precision required in height control and its weakness in vertical resolution. However, technological progress in geodetic measurement such as the GPS technique have addressed the first concern and opened a new era, for the cost effective utilization of gravity survey in many exploration works.
In this work, we present a high precession detailed gravity survey, carried out as part of an integrated geophysical survey to map potential areas for ground water resources in the arid Borena zone of the Oromia Regional State, Southern Ethiopia. The target area is situated on the eastern margin of the southern part of main Ethiopian rift. Being bounded by the volcanic mountains to the west and elevated grounds of basement rocks to the east, greater percentage of the study area is characterized by submerged grounds of volcanic plains underlain by thick basalt flows with fine to coarse columnar joint structures. The primary objective of the detailed gravity survey, in this framework, is to map geological structures and the Precambrian crystalline basement undulations, in those areas where other methods such as Vertical Electrical Sounding (VES), failed to prevail.
As a result, the subsurface is mapped in sufficient detail and adequate depth information is inferred from the gravity survey results. Moreover, low residual Bouguer gravity regions, reflecting regions of deeper basement and/or structural weakness in the overlying Cenozoic volcanics, have been found to be favorable targets to sink productive wells. Hence our result proved that employing high precision gravity survey, in conjunction with other geophysical methods such as VES and Magnetics in hydrogeophysical investigations, has not only delivered accurate basement depth constraint but also proved effective in identifying regions of high ground water potential.
Keywords: high precession gravity survey, basement depth, ground water potential
Poster Session
Hydrological Signals in Plate Boundary Observatory Borehole Strainmeter Data
Hodgkinson, Kathleen; Mencin, Dave; Borsa, Adrain; Jackson, Mike
PBO Borehole Strainmeter Group, UNAVCO; hodgkinson@unavco.org
The Plate Boundary Observatory includes 75 borehole strainmeters installed in targeted arrays between southern California and Vancouver Island, British Columbia. The purpose of the strainmeters is to capture short-term strain transients with periods of hours to weeks that fall between the detection levels of GPS and seismology. One of the main sources of non-tectonic noise in the borehole strainmeter data is that of irrigation and hydrological pumping. This noise must be extracted from the time-series in order to isolate any tectonic transients. Two strainmeter sites in particular, one on Vancouver Island and another close to the San Jacinto fault in southern California provide an opportunity to study the effect of irrigation and hydrological pumping on strain measurements. A seasonal signal is visible in the measurements from three strainmeters, all located within a few hundred meters of each other, on southern Vancouver Island. The source is believed to be the pumping of water from wells and the irrigation of fields about 1 km from the instruments. The signal is large enough that it can complicate the identification of any strain transient generated by Episodic Tremor and Slip events along the Cascadia subduction zone. In southern California, two strainmeters are located within 50 to 200 meters of a man made lake into which water is pumped. Isolation and removal of the hydrological signal would improve the ability to detect changes in strain rate along the San Jacinto fault in the strain data. The Vancouver Island and southern California instruments both provide an opportunity to study the effect of hydrological changes in strain measurements. Also, since the origin of the signal is known and the sites consist of two or more strainmeters the data allows the study of how the hydrological signal in the strain data can vary with distance from the noise source.
Measuring and Modeling Geosphere-Cryosphere Interactions in Southern Alaska
Sauber, Jeanne; Muskett, Reginald; Luthcke, Scott; Rolands, David
NASA Goddard Space Flight Center University of Alaska; Jeanne.M.Sauber-Rosenberg@nasa.gov
In the region of southern Alaska that includes the Malaspina and Bering Glacier systems, large ice fluctuations occur directly above a shallow main thrust zone associated with subduction of the Pacific-Yakutat plate beneath continental Alaska. We have used recent glacier elevation change studies [Muskett et al., 2008, 2009] and GRACE mascon-derived estimates of glacier mass fluctuations [Luthcke et al., 2008] to estimate ice mass variations from 1988 - 2007 for this region. Also, we calculated surface displacement rates, incremental stresses, and change in the fault stability margin of the solid Earth associated with these ice mass variations. In 2002-2006, for instance, the predicted displacement rates of the solid Earth due to average annual changes in ice loads were up to 20 mm/yr for the vertical and 3 mm/yr for the horizontal. In this same region, the predicted tectonic uplift rate in the same region is predicted to be 0-12 mm/yr and the horizontal rates 10-35 mm/yr.
An Evidence of Hydrological Signal in GPS time series in Poland
Rajner, Marcin; Liwosz, Tomasz; Rogowski, Jerzy B.
Warsaw University of Technology, Poland, mrajner@gik.pw.edu.pl
Currently well known influence of continental water loading on surface displacement can be measured by various geodetic methods. Among others satellite positioning is the most robust and easily available technique. In this paper we compare GPS measured position changes with deformations computed on the basis of global water storage models. We used GPS data from several Polish permanent sites with long-time measurement period available, applying Precise Point Positioning method using consistent IGS products. Results were corrected for other geophysical signals (tectonic, atmospheric). An overall good agreement (specially for height component) was found. Paper deals also with possibility of reduction of predominant yearly hydrological signal from positioning results. Simple model appropriate for studied area is introduced and its accuracy is estimated.
The GWR iGravTM Superconducting Gravity Meter
Warburton, Richard J.
GWR Instruments, Inc., 6264 Ferris Sq. San Diego, CA, 92121 USA; warburton@gwrinstruments.com
It is generally know that Superconducting Gravimeters (SGs) are far superior to spring-type gravity meters when used for making continuous gravity measurements over periods of months to many years. Spring-type gravity meters suffer from large non-linear drifts, variation in scale factor, and respond to changes in temperature and pressure. As a result, it is not possible to separate instrumental effects from real gravity changes. In contrast, the SG drift is extremely small (< 6 µGal/year) and highly linear over decades; and its scale factor is constant to better than 0.01 percent. Therefore, using SGs to replace spring gravity meters would significantly improve geophysical data in many applications. As an example, recent publications have shown that the SG provides precise measurements of local water storage changes (WSC). As an integrative tool, the SG can be used to evaluate or calibrate hydrological models that are extremely difficult to test in any other way. We expect a similar improvement in understanding and interpreting other geophysical phenomena after SGs replace spring gravity meters in these areas. Possible applications include: volcano and geothermal monitoring, measurement of silent earthquakes, stability of CO2 geologic sequestration, and subsidence caused by oil, water, or gas extraction. Due to their high cost, the complexity of the equipment, and perceived and real difficulty of operating and maintenance, SGs are normally restricted to observatories sites chosen to minimize noise over the whole range of gravity signals from periods of decades to 100 seconds. This eliminates many sites of high geophysical interest. To overcome these obstacles and to increase the utility of the SG, GWR Instruments has been developing the new iGrav? Superconducting Gravity Meter. The iGrav? is designed specifically for geophysical applications that require much higher stability and precision than provided by mechanical spring-type gravity meters, but can be set up easily and quickly without the need for an expensive platform, housing or infrastructure. In this poster, we delineate the advantages of the iGrav? to previous SGs and show recent data comparing the two types of SGs.
Groundwater monitoring with InSAR
Farr, Thomas G.
Jet Propulsion Laboratory, Pasadena, CA, tom.farr@jpl.nasa.gov
Groundwater is a significant source of fresh water in arid and semi-arid regions, but one that is difficult to monitor. In developed areas, wells can be drilled which are used both for extraction and for monitoring groundwater levels. However, the expansion and contraction of aquifers due to recharge and withdrawal of water can cause deformation of the Earth's surface which can be observed and measured by InSAR. Repeat-pass InSAR has been shown to be highly sensitive to surface deformation related to earthquakes, volcanoes, and fluid movements including oil and water. In particular, several studies have shown inflation and deflation directly correlated to recharge and withdrawal of water in Las Vegas, Phoenix, and Los Angeles. Time series of these data show a clear seasonal signal which correlates with groundwater levels in wells. Initial results from a study of California's Central Valley show that with C-band systems such as Envisat, decorrelation due to crops and plowing may be a major problem, but that there are enough towns and other areas that remain correlated so that the concept is still feasible. An important requirement is for continuing monitoring for at least a decade. A proof of concept study is now under way for a large part of the Central Valley.
Importance of a priori climate signal modeling for delineation of the coseismic gravity change after the 2010 great Maule (central Chile) earthquake from GRACE
Shin-Chan Han, Jeanne Sauber, Scott Luthcke
Planetary Geodynamics Laboratory, Code 698;NASA Goddard Space Flight Center; Greenbelt, MD 20771, USA.
The analysis of 4 months of GRACE inter-satellite tracking data, two months before and two months after the Maule (central Chile) earthquake (Mw 8.8) on 27 February 2010, shows the sudden changes in satellite orbits and gravity fields after the rupture.
In general, the coseismic gravity perturbation was smaller than or similar with the seasonal and inter-annual mass variation found in the surrounding areas including the Amazon and La Plata river basins and the Patagonia glacier ice field. At the GRACE's spatial scale, those 'nuisance' signals are important to eliminate from the GRACE data as accurately as possible in order to localize the smaller coseismic signal associated with the 2010 Maule earthquake.
We have used a priori global hydrology model (albeit only soil moisture) and a priori determination of the periodic mass changes from the GRACE data between 2004 and 2009 in order to predict the seasonal and inter-annual signals in 2010. Also a short-term (two months) difference in gravity solutions before and after the event was helpful in particular to remove the inter-annual signals appeared in the Patagonia and Antarctica peninsular.
Finally, we report that the gravity anomaly of -5 µGal with a spatial scale of 500 km was found east of the epicenter after the earthquake. Our estimate of long-wavelength gravity changes based on alternate coseismic models indicates that the interior deformation (mostly associated with intrinsic density change and characterized with negative anomaly) exceeds the surface deformation (causing positive anomaly) in the total gravity change at such spatial scale.
Deciphering postglacial rebound and groundwater processes in Canada & US mid-continent using absolute gravity, GPS and GRACE data
Lambert, Anthony 1; Henton, Joseph 2; Huang, Jianliang 2; Mazzotti, Stephane 1; Courtier, Nicholas 1
1 Geological Survey of Canada - Pacific; Natural Resources Canada, 2 Geodetic Survey Division; Natural Resources Canada; jhenton@NRCan.gc.ca
We examine similarities and differences in long-term trends and inter-annual signals between absolute gravity, vertical GPS, and GRACE time series at mid-continent North American sites. We find good agreement between the GPS and absolute gravity trends at most sites (both based on data acquired over more than a decade). The resulting gravity and uplift rates are compatible with ongoing postglacial rebound from the Laurentide ice sheet. In contrast, we find significant differences between the absolute gravity, corrected for vertical movement, and the GRACE trends at about half of the sites. This is possibly due to the difference between the two techniques in spatial averaging of the dominant postglacial rebound processes. At some of the sites (e.g., Pinawa and International Falls), both the absolute gravity and GRACE time series show a significant inter-annual signal, with a good agreement in phase and amplitude between the two techniques. Comparison with flow rate data of the Winnipeg River suggests that this inter-annual signal may be related to large-scale variations in groundwater storage. Preliminary analysis does not show a significant inter-annual signal in the GPS time series for the same sites. The difference in response between gravity and GPS, and how it may relate to groundwater storage, will be investigated.
Session BS1:
Late 20th and early 21st century deep-seated vertical motions of New Orleans and implications for hydrologic and tectonic influences on causation
Dokka, Roy K.1; Dixon, Timothy H.2; Ivins, Erik R. and Blom, Ronald G.3
1 Louisiana State University, Baton Rouge, LA 70803. 2 University of Miami 3 Jet Propulsion Lab/California Institute of Technology; rdokka1@lsu.edu
Land- and space-based geodetic data and water level measurements in the New Orleans-Lake Pontchartrain area were analyzed to infer vertical motions and to test models of causation. Measurements from water gauges attached to bridge foundations, InSAR targets on homes resting on piles, and benchmarks affixed to deep rods that avoid the effects of shallow processes such as compaction and consolidation of Holocene sediments yield consistent results after gauge adjustments and datum reconciliation. Results show that the entire sampling area subsided during the late 20th century, with the maxima of deep subsidence occurring in the urbanized and industrialized sections of eastern New Orleans. Subsidence due to processes originating below the Holocene section locally exceeded 0.9 m between 1955 and 1995. Relative sea-level rise during the same time interval was not uniform, varying between ~0.25 and ~1.2 m. Subsidence decreased away from urbanized areas and north of the belt of active basin margin normal faults; this decrease in subsidence continued to the north and east along the Mississippi coast. These independent, yet consistent measures of vertical motions provide insights into the complexity and causes of modern landscape change in the region. First, the magnitude and horizontal extent of deep subsidence are much greater than can be explained by models that consider modern subsidence to be mainly due to compaction and consolidation of Holocene sediments. Previous models are extrapolations of middle and late Holocene sea-level measurements that lack sufficient horizontal and vertical sampling, spatial and temporal precision, and accuracy to capture the variability late 20th century vertical motions. Thus, processes operating beyond the footprint of the Mississippi River delta (MRD) such as lithospheric loading and relatively short-lived drivers of subsidence such as groundwater withdrawal and active faulting are missed. Second, deep subsidence occurring east and north of the basin margin faults can be explained by regional tectonic loading of the lithosphere by the modern Mississippi River delta and local groundwater withdrawal. Third, sharp, local changes in subsidence coincide with strands of the basin margin normal fault system. Displacements are consistent with modern activity and show motion behavior consistent with ancient growth faults. Fourth, deep subsidence of the region to the south, including New Orleans, can be explained by a combination of groundwater withdrawal from shallow upper Pleistocene aquifers, the aforementioned lithospheric loading, and non-groundwater-related faulting. Near Michoud, substantial local subsidence also originates at depths >1.8 km below producing aquifers, suggesting that active regional faulting occurs within the MRD. Subsidence due to groundwater extraction from aquifers ~160 to 200 m deep dominated the urbanized areas from ~1960 to the early 1990s and is likely responsible for lowering flood protection structures and bridges in the area by as much as ~0.8 m. The slowing of subsidence from the early 1990s to the present in all areas, except Michoud, was coincident with the stabilization of groundwater level in a regional reference well. This suggests that lithospheric loading may be the dominant current process causing deep subsidence.
Towards Geodetic Observation of Active Mountain Growth in the Sierra Nevada/Great Basin Transition
Hammond, W.C.; Blewitt, G.; Plag, H.-P.; Kreemer, C.
Nevada Geodetic Laboratory, Nevada Bureau of Mines and Geology; whammond@unr.edu
Topographic relief across the Sierra Nevada and Great Basin of the western United States is dominated by mountain ranges and valleys that are the product of active tectonic deformation. The rates of growth of these mountains, i.e. the generation of relief through slip on range-front faults and tilting of crustal blocks are the subject of controversy. For example, estimates of the age of modern Sierra topography vary by one order of magnitude, from 3 to 30 million years. With present elevations near 3 km, the more rapid of these implied rates is within reach of GPS measurement precision (likely <0.5 mm/yr for permanent continuous stations with many years of data). We evaluate the ability of data from western U.S. high precision GPS networks, e.g. EarthScope Plate Boundary Observatory (PBO) and the University of Nevada Mobile Array of GPS for Nevada Transtension (MAGNET) to constrain 1) the rate of vertical motion and tilt of the Sierra Nevada/Great Valley microplate, and 2) normal faulting rates which indicate active uplift on fault-bounded blocks in the Sierra Nevada range front, Walker Lane and Basin and Range. To facilitate this we employ a block model that is constrained by vertical and horizontal GPS components, which uses measurements made in the interseismic time to infer long-term rates. Because we seek to infer long term uplift rates we must also correct for postseismic transients from earthquakes that can distort the GPS velocity field. The signal of viscoelastic relaxation from historic earthquakes in Central Nevada is clearly visible in the vertical velocity field. We remove this transient relaxation by subtracting the predictions from a model of the viscoelastic process. The vertical component from the rebound of postglacial Pleistocene lakes in the Great Basin (e.g. Lake Lahontan), secular and annual changes of snow load on the Sierra Nevada also need to be considered, however, the contributions that these processes have to the modern geodetic rates is less certain and needs to be explored. Preliminary results indicate that several long-running stations on the west slope of the Sierra Nevada move upward at near 1 mm/yr, in agreement with models that call for a younger Sierra Nevada. PBO stations running over 3 years corroborate this rate of motion but are less precise owing to their shorter time series.
The View of Lithosphere Rheology from Interseismic Deformation: Potential Biases Due to Model Simplifications
Hetland, Eric A.; Moore, Samantha
Dept. of Geological Sciences University of Michigan; ehetland@umich.edu
Geodetic observations of tectonic related deformation are routinely used to make inferences about the rheology of the ductile lithosphere (i.e., the crust and uppermost mantle). All of these inferences require the use of mechanical models, which often idealize the structure of the crust and/or upper mantle. Most commonly, models only consider a homogeneous lower crust and homogeneous upper mantle, and only include Maxwell viscoelasticity. However, the rheology of the ductile lithosphere is likely more complicated than Maxwell viscoelasticity, and material properties are expected to be depth-dependent throughout the lithosphere. Without further verification, it is unknown if rheological inferences made using idealized models are valid over time or length scales other than those that the geodetic data capture or are sensitive to, nor is it known how idealized rheologic inferences relate to more complex rheologies. Here we focus on model based inferences made from geodetic observations of interseismic deformation, specifically we address how geodetic data contributes to the fundamental question of whether the lower crust is stronger or weaker than the upper-most mantle. Many mechanical models constrained by geodetic observations require that the uppermost mantle is weaker than the lower crust. Most of these models ignore any depth-dependence of material properties within the lower crust or mantle. Several past studies have demonstrated that viscous creep at different depths has a varying affect on surface displacements at either different times or distances from the fault. In general, the apparent viscosity in interseismic deformation models with homogeneous Maxwell viscoelasticity increases during the early interseismic period, and then decreases again during the later interseismic period, while the apparent elastic thickness initially slightly decreases and then increases at later times. Moreover, from surface deformation alone, it is not always possible to uniquely image relatively thin weak layers sandwiched between stronger layers, and even with only linear Maxwell rheologies, weak layers can appear to be strong from the geodetic viewpoint at certain times in the earthquake cycle. Finally, if the rheology of the ductile lithosphere is non-Maxwellian, model inferences made assuming purely Maxwell rheologies may not reflect the true rheology of the ductile lithosphere. In this presentation, we illustrate several cases where rheological complexity strongly influences surface deformation and may bias conclusions made from more simplified models. Our ultimate goal is to quantify the correspondence between simplified models and more complex models.
Absolute gravity measurements in the Taiwan orogen
M. Mouyen*(1), F. Masson(1), C. Hwang(2), C-.C. Cheng(2), N. le Moigne(3), C-.W. Lee(4), R. Kao(4), W.-C. Hsieh(4)
*maxime.mouyen@eost.u-strasbg.fr
(1) IPGS – UMR7516 – CNRS , 5 rue René Descartes F67084 Strasbourg Cedex, France
(2) Department of Civil Engineering, National Chiao-Tung University, 1001 University road, Hsinchu, Taiwan 300, R.O.C.
(3) Géosciences Montpellier, Université Montpellier 2 – CNRS, Place E. Bataillon, 34095 Montpellier cedex 5, France
(4) Center for Measurements Standards, Industrial Technology Research Institute, Sec.2 Kuang Fu Rd., Hsinchu, Taiwan 30011, R.O.C.
Time-lapse microgravity is an efficient tool to monitor mass transfers and ground vertical movements. Hydrological, volcanologic or tectonic investigations take advantage of this method, which last improvements allow a measurement accuracy about 1 microgal (1 microgal=10-8 m·s-2). We present here results of yearly repeated absolute gravity surveys performed in Taiwan since 2006, as part of the Absolute Gravity in the Taiwan Orogen (AGTO) project, which focus on tectonic processes in this active area. The survey contains ten sites distributed along a globally east-west transect, in the south of the island, between Taitung and Tainan cities. This transect thus crosses the fives main geologic features of Taiwan, from the Coastal Range in the east to the Coastal Plain in the west. As g change results of any mass transfer around the measurements site, its straightforward tectonic interpretation cannot be performed. In particular, water effects are likely to account for some microgals. We try here to separate both effects. Concerning tectonic effects, vertical movements can be redundantly monitored by permanent GPS or precise levelling but deep mass transfers are theoretically accessible only using gravimetry so we need a modelling approach to clarify what could be expected. Concerning hydrology, we estimate its effects using global hydrological models and local rainfall data. Modelled deep mass transfers are small (lower than 1 microgal/a) and cannot be detected in our still short time series (4 years). But the gravity changes can be first explained considering vertical movements measured by GPS and erosion, active in Taiwan. It then appears that the remaining gravity signal can be correlated to rainfall amount. We try to understand this correlation by studying hydrological processes occurring near our gravity sites.
Using GLDAS for computation of the hydrological loading signal
Petrov, Leonid
ADNET Systems/NASA GSFC; Leonid.Petrov@lpetrov.net
The Global Land Assimilation System (GLDAS) provides the field of soil moisture and accumulated snow cover starting from January 1979 and continuously update with a resolutions of 1/4deg x 1/4 deg x 3 hours and 1deg x 1deg 1 3 hours. We used these GLDAS products and computed the time series of displacements caused by the hydrological loading from the Noah, CLM, Mosaic, and VIC models for both a set of ~1000 space geodesy fundamental stations and for 1deg x 1 deg grid. Using a set of VLBI observations, we investigated the presence of modeled hydrological signal in observations.
A novel modeling approach for diffusion-dominated systems
Lipovsky, Brad; Funning, Gareth
UC Riverside, Riverside, CA, USA, lipovsky@ucr.edu
We present a novel and succinct method for analyzing diffusion-dominated systems using an eigen-decomposition method. It is well known that eigen-decomposition methods such as Principal Component Analysis (PCA) can be used to decompose large data sets into statistically representative patterns, however, a major limitation of this method is often that these patterns need correspond to any physical event or process. We present a geodetic data set that does not have this encumbrance. We use an eigen-decomposition on a data matrix, D, to achieve a separation of variables, D(x,t) = X(x) * T(t). We show that the separated functions satisfy a simple diffusion equation. We demonstrate this new technique in the Evergreen Basin, CA, and show that a persistent scatterer InSAR data set with O(10^5) data points may be elegantly represented with only several physical parameters.
Session BS2:
Seasonal geodetic strain in the Himalaya induced by surface load variations and implications for shallow elastic structure of the Earth
Avouac, Jean-Philippe1; Chanard, Kristel1,2; Ito, Takeo1; Genrich, Jeff1; Galetzka, John1; Flouzat, Mireille3; and NSC team4
1) Tectonics Observatory, California Institute of Technology, Pasadena, CA;
2) Department de Geosciences, Ecole Normale Superieure, Paris;
3) Laboratoire de Detection Geophysique, Commissariat a l'Energie Atomique, Bruyeres-le Chatel, France;
4) National Seismological Center, Department of Mines and Geology, Kathmandu, Nepal
We analyze geodetic time series from continuous Global Positioning System (GPS) stations across the Nepal Himalaya. As previously reported, strong seasonal variations are observed on both horizontal and vertical components (Bettinelli, 2008). We confirm here that seasonal variations of surface loading, due mostly to continental water storage, is probably the primary cause for these geodetic seasonal variations. In addition we show that this effect can be used to constrain the shallow elastic structure of the Earth. The integrated land water mass determined from the global time variations of the Earth’s gravity field measured by the Gravity Recovery and Climate Experiment (GRACE) is used to estimate surface load variations. To test the proposed model we take advantage of a larger dataset of GPS time series in the India – Nepal – Tibet area and a longer time period of GRACE water storage data than previous studies. We model seasonal variations of geodetic surface displacements using first an elastic half-space approximation (Boussinesq, 1885) and find that the observed signal at a number of stations in Nepal and India can indeed be predicted reasonably well. The best fit, in the least squares sense, is obtained for an elastic modulus of 145 GPa. This model is however difficult to assess given that it ignores the spherical and internal structure of the Earth. We therefore show simulations based on a more realistic spherical layered Earth structure (Farrell, 1972; Guo, 2004) . We consider an initial model based on the Preliminary Reference Earth Model (PREM), which is found to underestimate seasonal displacements amplitude. We next determine a best fitting model, in the Bayesian sense (Fukuda, 2008), by adjusting the distribution of velocities and density with depth to best match the geodetic time series. Variations by up to 10%, relative to PREM in the upper 200 km are inferred. The correction of the effect of surface load variations allows estimating better secular geodetic rates. It also enhances detection of eventual transient strain events like slow earthquakes.
Ground motion measurement in the Lake Mead area, Nevada, by differential synthetic aperture radar interferometry time series analysis: Probing the lithosphere rheological structure
Doin, Marie-Pierre; Cavalié, O.; Lasserre, C.
Ecole Normale Supérieure, Paris, doin@geologie.ens.fr
SAR interferometry has proven to be a reliable method for detecting small displacements due to ground subsidence. In this study, we measure ground motion around the lake Mead (Nevada, USA) using InSAR. This artificial lake has been filled with water in 1935. An earlier study, based on leveling measurements, has shown that the load associated with lake impoundement induced a subsidence of 17 centimeters (Kaufmann and Amelung, 2000). This relaxation process has been argued as analogous to the postglacial rebound, but at a smaller spatial scale and with a much lower viscous relaxation scale. To quantify the deformation and thus constrain the crust and mantle rheological parameters in the lake area, we analyze multiple small baseline interferograms (~500) based on 62 ERS images acquired between 1992 and 2009 and on 40 ENVISAT images acquired between 2003 and 2010. All interferograms show a very good coherence due to arid conditions. On most interferograms, strong atmospheric patterns mask the deformation signal. The atmospheric delays are partly due to the variation of water vapor vertical stratification between two satellite passes. This tropospheric delay is correlated with elevation on the interferometric scene. It can thus be estimated and corrected from the interferometric phase. This correction is validated using dry and wet delays computed from global atmospheric models (ECMWF). Corrected interferograms are then inverted to solve for the time series of ground motion in the lake Mead area. The linear inversion treats each pixel independently from its neighbours and uses the data redundancy to reduce errors such as local decorrelations or a few local unwrapping errors. Additional constraints such as temporal smoothing allow to reduce the turbulent atmospheric delays. We obtain spatio-temporal series of the deformation in the lake Mead area from 1992 to 2010. The deformation is non linear in time and spreads over a large spatial scale. A few areas connected with the lake show ground displacements interpreted as poro-elastic deformation in a connected aquifer in sedimentary layers. We also observe a broad subsidence pattern of up to 16 mm between 1995 and 1998 due to a 10 meters water level increase, followed by a stronger uplift due to the drop of the water level after 2000. We model the deformation, taking into account the water and sediment loading history of the lake since 1935. A simple elastic model with parameters constrained by seismic wave velocities does not explain the amplitude of the observed motion. The two-layer visco-elastic model proposed by Kaufmann and Amelung (2000), with a mantle viscosity of 10**18 Pa s, adjusts well the data amplitude and its spatio-temporal shape. We will discuss the models that could explain the broad deformation pattern taking into account errors derived from atmospheric perturbations.
Separating Tectonic, Magmatic, Hydrological, and Landslide Signals in GPS Measurements near Lake Tahoe, Nevada-California
Blewitt, Geoffrey; Kreemer, Corné; Hammond, William C.; Plag, Hans-Peter
Nevada Geodetic Laboratory, Nevada Bureau of Mines and Geology, University of Nevada, Reno; gblewitt@unr.edu
We present two case studies of GPS measurements recorded in the region of Lake Tahoe, Nevada-California, where signals evidently represent some mix of tectonic, magmatic, and hydrological processes, and discuss clues that have been used to help unravel their relative contributions to the total signal. In both cases, the pattern of seismicity and its timing was critical, as well as consideration of spatial and temporal patterns of deformation that likely arise from each process. The first case study involves the Slide Mountain GPS Transient of 2003, previously reported by Smith et al., [2004, doi:10.1126/science.1101304], who inferred evidence for magma injection beneath the north shore of Lake Tahoe associated with deep (> 20 km) earthquake activity. During a 5 month period, a GPS station atop Slide Mountain, which lies 18 km northeast of the earthquake swarm, moved 6 mm horizontally and 8 mm upward. Separating the magmatic transient from tectonics and hydrology required extrapolation of the time series residuals derived from modeling of pre-transient data. The pre-transient data were modeled as secular tectonics (fit with station velocity parameters) plus seasonal hydrological loading (fit with annual and semi-annual sinusoids). We re-examine this event now that more than 6 years have passed since the end of the transient, using more recently advanced GPS processing techniques. Questions of interest include: (1) To what extent is the 5-month transient affected by seasonal hydrological signals that do not repeat exactly from year to year? (2) Does the post-transient station velocity differ from the pre-transient velocity, and if so, what does that imply for tectonic-magmatic processes at Lake Tahoe? We attempt to find clues to the latter question by interpolation of the regional strain field inferred by GPS farther from the swarm. We find that the magmatic transient occurred at the edge of a larger area, centered on the Steamboat Springs geothermal area, for which we find relatively high secular uplift and east-west extension. We postulate a regional magmatic doming process to be responsible for both the anomalous secular and transient deformation, and the presence of high temperatures in the area. In the second case study, we present results of transient GPS signals associated with the Mogul-Sommerset earthquake swarm of 2008 just west of Reno, Nevada. This case study illustrates how problematic hydrological signals were identified at one GPS station and were rejected based on site stability considerations. The tectonic (versus hydrological or magmatic) origin of the observed signal from the remaining stations was confirmed by (1) models and observations of the spatio-temporal pattern of surface displacements within a few kilometers of the swarm, (2) the timing of surface displacement in relation to that of seismic moment, and (3) the strain release pattern in relation to the regional inter-seismic strain field inferred by distant GPS stations. In addition, hypothetical landslide signals were rejected by careful experiment design informed by historical activity.
Complementary gravimetric monitoring of water storage changes - lysimeters and superconducting gravimeters
Creutzfeldt, B.1; Güntner A.1; Merz, Bruno1; Wziontek, H.2
1 GFZ German Research Centre for Geosciences, Section Hydrology, Potsdam, Germany; 2 Federal Agency for Cartography and Geodesy (BKG), Section National Reference Systems for Gravity, Frankfurt am Main, Germany; benjamin.creutzfeldt@gfz-potsdam.de
Lysimeters provide an accurate measurement of the gravimetric soil moisture change by continuously recording the mass of a soil monolith. Weighable, suction-controlled and monolithic lysimeters can also be considered as very accurate devices to measure precipitation and deep drainage and they are, in fact, the only device to directly measure the actual evapotranspiration. Superconducting gravimeters (SG) are currently the best performing gravimeters to study relative gravity variations in time in terms of precision and temporal resolution. The Geodetic Observatory Wettzell is the only place where both gravimetric monitoring systems - a state-of-the-art lysimeter and a dual sphere SG - operate in parallel at a distance of around 40 m. In this study, we present the first comparison of lysimeter and SG measurements. Lysimeter data are used to estimate WSC at the field scale in combination with complementary hydrological observations and a hydrological 1D model. At the Geodetic Observatory Wettzell (Germany), WSC in the snow pack, top soil, unsaturated saprolite and fractured aquifer are all important terms for the local water budget. We calculate the hydrological gravity response from the estimated WSC, taking into account the mass distribution in space. A comparison of the gravity response and the SG residuals shows that local WSC and the SG residuals are highly correlated on the event and seasonal scale. We find that the gravity residuals are caused to a larger extent by local WSC than previously stated. Lysimeter measurements significantly improve the independent estimation of WSC and thus provide a better way of reducing the local hydrological effect from gravimeter measurements.
Groundwater Monitoring in a Karst System using ground-based geodetic techniques
Jacob, Thomas 1; Bayer, Roger 2; Boudin, Frederick 2; Champollion, Cedric 2; Chery, Jean 2; Deville, Sabrina 2; Le Moigne, Nicolas 2; Vernant, Philippe 2
1: CIRES and Dept. of Physics, University of Colorado, Boulder, USA 2: Geosciences Montpellier, Université Montpellier II, Montpellier, France; thomas.jacob@colorado.edu
Water storage variations in a karst aquifer of ~ 100 km2 on the Larzac Plateau (South of France) has been monitored using a combination of ground-based gravity techniques and long baseline tiltmeters for over three years. Geodetic instruments are set up with the sole purpose of collecting novel information on the functioning of karst aquifers, whose structural heterogeneity makes them challenging to monitor with classical hydrological methods. Ground based gravity techniques comprise the following: - Monthly absolute gravity measurements at three sites, yielding water storage change (WSC) in the vicinity of the sites with no depth resolution. The recorded annual cycle is in the order of 10-20 µGal. - Twice-yearly surface to depth gravity measurements between the surface and 60 m depth, yielding complimentary information on the vertical location of WSC. - Twice-yearly microgravity surveying at 40 stations covering the karst recharge area, allowing for basin scale WSC to be monitored between 'wet' and 'dry' periods. Combining these gravity techniques allows for a better quantification of WSC from local scale (~50-100 m) to basin scale (~5-10 km). Recorded gravity signals are interpreted in the light of conceptual hydrological reservoir models. Long baseline tiltmeters set up in caves at two sites record pulse-like tilt signals after heavy precipitation events, with amplitudes of some ærads. These are attributed to the vertical transfer of water in nearby fractures, and allow for a quantification of infiltration dynamics.
Session BS3
Modeling Secular Crustal Motion and GRACE Trends for Separation of Surface Glacial Hydrology and Mantle Isostatic Flow
Ivins, Erik R.
Climate, Oceans and Solid Earth Section, JPL/Caltech, Pasadena, CA; Erik.R.Ivins@jpl.nasa.gov; http://science.jpl.nasa.gov/people/Ivins/
The ice sheets of Greenland and Antarctica and the smaller glacier systems of Patagonia, Alaska, Svalbard Is., Norway, Baffin Is., the Canadian Rockies, etc., are all cryopsheric systems affected, one way or another, by warming global temperatures. Changes in these hydrological systems may have solid Earth responses associated with surface mass redistribution of the present and past that are not elastic. The GRACE satellite system has recorded glacial hydrological trends now for more than 8 years. Land glacier extent and volume in the Antarctic Peninsula have been in a state of dramatic demise since the early 1990?s. Using JPL global mascons, and other harmonic releases by the various analysis centers, GRACE gravity trend observations have recently been combined with Global Positioning System (GPS) bedrock uplift data in order to simultaneously solve for ice loss and for viscoelastic Earth glacial isostatic adjustment (GIA). The bedrock uplift owes to Holocene and Little Ice Age (LIA) cryospheric loading-unloading sequences. Methods are discussed that solve for the present-day ice loss rate at -41 ñ 6 Gt/yr in northern Peninsula, as well as regions south of 67oS. The estimates are shown to be consistent with changes in thickness and out-flux using InSAR and speckle-tracking in the 5 years that preceded the GRACE observing period; 2003-2010. Bounds are recovered for elastic lithosphere thicknesses of 20 ≤ h ≤ 50 km and on upper mantle viscosities of 3 x 10¹⁹ ≤ ? ≤ 1020 Pa s. Antarctic Peninsula ice models with a prolonged LIA, extending to AD 1930 are favored in all ?2 fits to the GPS uplift data. This result is largely decoupled from Earth structure assumptions for a range of reasonable load-unloading histories that we sample in the study. The GIA corrections are important, as they account for a large fraction of the space-determined secular gravity change. Collectively, when combined with observations of 1998-2002, the on-land ice losses correspond to mass increases of the oceans equivalent to 0.12 ñ 0.025 mm/yr of sea-level rise for the last 15 years. For several target areas near the Trinity Peninsula and northern Graham Land, the GIA-corrected mass losses are directly compared with ICESat-determined ice height changes spanning 2002-2007.
Accelerating uplift in the North Atlantic region as an indicator of ice loss
Jiang, Yan; Dixon, Timothy H.; Wdowinski, Shimon
University of Miami, Miami, FL, shimonw@rsmas.miami.edu
Vertical motions of the rocky margins of Greenland and Antarctica respond to mass changes of their respective ice sheets. However, these motions can be obscured by episodes of glacial advance or retreat that occurred hundreds to thousands of years ago, which trigger a delayed response because of viscous flow in the underlying mantle. Here we present high-precision global positioning system (GPS) data that describe the vertical motion of the rocky margins of Greenland, Iceland and Svalbard. We focus on vertical accelerations rather than velocities to avoid the confounding effects of past events. Our data show an acceleration of uplift over the past decade that represents an essentially instantaneous, elastic response to the recent accelerated melting of ice throughout the North Atlantic region. Our comparison of the GPS data to models for glacial isostatic adjustment suggests that some parts of western coastal Greenland were experiencing accelerated melting of coastal ice by the late 1990s. Using a simple elastic model, we estimate that western Greenland's ice loss is accelerating at an average rate of 8.7±3.5 Gt/y^2, whereas the rate for southeastern Greenland-based on limited data falls at 12.5±5.5 Gt/y^2.
Deciphering tectonic, isostatic, oceanic and anthropogenic signals in combined GPS, absolute gravity, InSAR, and tide gauge data in the northern Cascadia subduction zone
Mazzotti, Stephane; Lambert, Anthony; Henton, Joseph; Dragert, Herb; Schmidt, Schmidt
1. Geological Survey of Canada, Sidney BC, Canada; smazzotti@nrcan.gc.ca
Geodetic measurements in southwestern Canada are affected by a variety of processes over different spatial and temporal scales. On a regional scale, the present-day interseismic locking of the Cascadia subduction thrust results in margin-normal shortening and tilting of the Cascadia forearc. Although clear ? and fairly simple ? in horizontal GPS data, this subduction-loading signal is not well resolved in geodetic data that sense vertical motion (e.g., leveling, absolute gravity, tide gauge, InSAR). This is due to the fact that those techniques are also sensitive to a variety of other processes on a regional scale (e.g., postglacial rebound, sea-level rise) and more local scales (e.g., anthropogenic subsidence.). Deciphering and quantifying these various processes and their respective effects can be attempted by combining the geodetic datasets and comparing them with numerical model predictions. This type of analysis also reveals limitations and discrepancies among the different techniques. For example, we estimate the 20th century regional sea-level rise to be either +1.8 ñ 0.2 mm/a or -0.5 ñ 0.3 mm/a, depending on whether the tide gauge data are aligned to the ITRF200 or to the regional absolute gravity reference frame. On a more local scale, the combination of geodetic data and numerical models can be used to discriminate between large-scale and local-source signals. We show the example of the Fraser River Delta (greater Vancouver), where local vertical motion measured by leveling, GPS, and InSAR can be partitioned between long-term tectonics (~0 mm/a) and natural sediment compaction (~2 mm/a), and transient anthropogenic effects (primarily induced load compaction, 5 ? 10 mm/a).
Tectonic, Climatic and Anthropogenic effect in Western Europe by Repeated Absolute Gravity Measurements
Van Camp, Michel 1; de Viron, Olivier 2; Lecocq, Thomas 1; Hinzen, Klaus Guenter5; Quinif, Yves 3; Williams, Simon 4; Camelbeeck, Thierry 1
1. Royal Observatory of Belgium, Brussels, Belgium. 2. IPGP-U. Paris Diderot, Paris, France. 3. U. Mons, Mons, Belgium. 4. Proudman Oceanographic Laboratory, Liverpool, UK. 5. Earthquake Geology, Cologne University, Germany; mvc@oma.be
In continental plate interiors, tectonic deformations are small and the associated ground surface movements remain close to or below the accuracy of current geodetic techniques, and at the limit of the noise level. An absolute gravimeter is an appropriate tool to quantify slow vertical movements, as this instrument, based on length and time standards, is drift free and does not depend on any terrestrial reference frame. Repeated absolute gravity (AG) measurements have been performed in Oostende (Belgian coastline) and at 8 stations along a southwest-northeast profile across the Belgian Ardennes and the Roer Valley Graben (Germany), in order to estimate the tectonic deformations in the area. After 7-13 years (depending on the station), we find evidence that the gravity rates of change are no larger than a µGal per year and result from a combination of anthropogenic, climatic, tectonic, and Glacial Isostatic Adjustment (GIA) effects. This demonstrates the importance of precisely modeling the GIA effects in order to investigate intraplate tectonic deformations at the sub-millimeter level. This study also shows that AG measurements, repeated once or twice a year, can resolve gravity changes at the 2 nm/s2/yr level (equivalent to 1 mm/s2 vertical velocity) after 10 years, even in difficult conditions, provided that the gravimeter is carefully maintained.
Session BS4
Low-Degree Gravity Change and Surface Mass Variations
Chen, Jianli; Wilson, Clark
Center for Space Research, University of Texas at Austin, Austin, TX, chen@csr.utexas.edu
The Earth gravitational variation is caused by mass redistribution within the Earth system, including the atmosphere, ocean, land, cryosphere, and solid Earth. Gravitational change can be quantified by geodetic measurements and numerical models. In this study, we examine time series of low-degree gravitational variations, ΔC21, ΔS21, and ΔC20 estimated from four different methods, including satellite gravimetry from the Gravity Recovery and Climate Experiment (GRACE), Earth Orientation Parameters (length of day and polar motion), advanced climate models (including atmospheric, oceanic, and hydrologic models), and satellite laser ranging. We compare these independent estimates at different time scales, and discuss major uncertainties for the various techniques. These independent estimates of ΔC21, ΔS21, and ΔC20 are important for validating geodetic techniques and for improving understanding of large-scale mass redistribution within the Earth system. We will examine the low frequency variability of these low degree gravitational changes and its possible connection to large-scale climate change events within the Earth system, including ice loss from polar ice sheets and mountain glaciers, terrestrial water storage change, and sea level change.
Consistency and Complementarity among Gravity, Deformation, and Ocean Model in the Global Inverse Framework
Wu, Xiaoping; Collilieux, Xavier; Altamini, Zuheir; Vermeersen, Bert L. A.; Gross, Richard S.
Jet Propulsion Laboratory, CALTECH; Xiaoping.Wu@jpl.nasa.gov
Gravity, deformation, geocenter motion, bottom pressure and Earth rotation are different manifestations of present-day and historical surface mass transport, tectonic and other geophysical processes. Observed by multiple satellite geodetic techniques, they can be used to cross-validate in cases of overlapping information, and to complement for global coverage, high resolution and accuracy. We identify the underlying geophysical processes and examine information contents of these data types in a global inverse framework for redundancies and deficiencies. For seasonal and interannual time scales, the multiple data sets provide complete global spatial and spectral coverage on surface mass variations and offer many facets of redundancies. We will compare various direct and inverse observations of geocenter motions, low-degree spherical harmonic coefficients of surface mass variations. For secular trends, we will compare polar wander observations with degree-2 and order-1 gravity trends. However, errors and lack of quantitative uncertainty assessment of glacial isostatic adjustment (GIA) models cloud the evaluation of consistencies among the data sets. To separate present-day surface water transport trend from GIA, barely enough data exist and a priori information has to be used carefully. Tremendous progress has been achieved since GRACE was launched in 2002. Still, inconsistencies exist among different data types, which need further improvement.
Session P6
Meeting the Geodetic Challenge of the NRC's Decadal Survey
John LaBrecque
Lead, Earth Surface and Interior Focus Area, NASA Earth Science Division, Washington, DC 20546, USA
NASA's Space Geodesy Program within Earth Science Division is aligned with the goals and missions identified within the NRC’s Decadal Survey (Earth Science and Applications from Space, 2007, (www.nap.edu)) and the SESWG Report (Solid Earth Sciences Working Group Report entitled Living on a Restless Planet (solidearth.jpl.nasa.gov/seswg.html) as reviewed by the National Research Council, (www.nap.edu).
The NRC Decadal Survey identified over six missions to be developed during the next decade that will rely significantly upon the science and data products of the Global Geodetic Observing System. Furthermore, the NRC report expressed great concern that this very same global geodetic infrastructure is on the verge of collapse.
This paper reports on the efforts of NASA and its national and international sister agencies to reverse that trend of collapse, to meet the measurement goals of the NRC Decadal Survey, and to achieve the vision expressed in the foundation document of the Global Geodetic Observing System (Plag and Pearlman, 2009). These efforts include advancing the geodetic technology and infrastructure and developing the DESDynI, GRACE Follow-On, ICESat-II, and GPS radio occultation geodetic satellite missions.